
Overview
What are mycorrhizal relationships and why use a network chart to visualize them?
Fungi play a vital role in the ecosystem by forming symbiotic (and sometimes parasitic) relationships with various plant species, which form what are called mycorrhizal networks. These networks are often mutually beneficial relationships, where plants exudate essential materials for fungi and fungi in turn can supply plants with water and nutrients such as phosphorous. While I am not modeling a specific mycorrhizal network in this visualization, I am modeling general relationships between different taxonomic entities, with a drill down feature for hierarchies within the fungus kingdom. Perhaps a visualization for an actual forest network would be a fun project for the future.
Using the D3.js force module
One of the most fun aspects of the D3.js library to work with is its force module. The force module is initialized by creating a simulation which works by creating a velocity Verlet numerical integrator, an algorithm that allows a model to compute the trajectory of specific nodes within a system that accounts for all the for forces operating on them.
The velocity Verlet is comprised of three basic steps:
- Use the Taylor expansion to update the position of the node
- Calculate the new acceleration by plugging that position into the equation for system force – F
- Calculate the new velocity of the node
It’s also worth noting that the force module leverages a metaheuristic algorithm called simulated annealing for optimizing movement calculations using a randomized temperature cooldown function. This feature can be tweaked using the various alpha-related variables.
The forces within the force simulation can then be defined using a series of different forces, listed below:
- Center Force – This force acts as a gravitational force that is designed to keep the nodes centered around a specific position (often to keep them from literally flying off the chart).
- Collide Force – Used to help prevent or minimize node collisions.
- Link Force – Used set distance when nodes have defined links, similar to a spring.
- Many-body Force – Simulates the force of every node acting on every other node within the system.
- Positional Forces – defined as forceX, forceY, and forceRadial. These forces can define specific centers for nodes, and are sometimes used in place of the Center Force.
The benefit of using the force module for building network/node-edge visualizations is that the simulation can help initialize meaningful positions for nodes based on whatever criteria you desire. Also, when the user begins dragging the nodes there’s some utility in having movement within the system, specifically maintaining the interesting force relationships and interactions defined.
Structure and Implementation of the Visualization
Defining relationships and hierarchy
Relationships between nodes are encoded as edges or links, and the relationships can be defined as either direct or hierarchal. This mycorrhizal relationship visualization features two different types of relationships: taxonomic (hierarchal based on Linnaean taxonomy) and mycorrhizal (direct relationships between fungi and plants). Both of these relationships have very different qualities, and are computed differently within the system.
The mycorrhizal links are direct relationships that enter the system predefined along with the nodes, while the taxonomic links must be derived by creating an hierarchy of the nodes. The hierarchy module in D3.js is useful for transforming the nodes into an hierarchal format that can be used by other D3 modules. d3.hierarchy can be called for datasets that are already structured in an hierarchal format, or d3.stratify to preprocess data that is in tabular format.
The data that’s being used in this visualization is in tabular format, so using d3.stratify is the best approach. The issue is that a singular root node must exist in the data, else there will be a “Many roots” error. Since my data did not originally have a single root node, I had to create one named “Mycorrhizal Network” and define it as the parent for all of the root nodes. Since the plant/tree nodes in this data aren’t arranged hierarchically, I also defined the new root node as their parent.
What were the requirements for the successful implementation of this visualization?
Use color and size to differentiate the types of nodes.
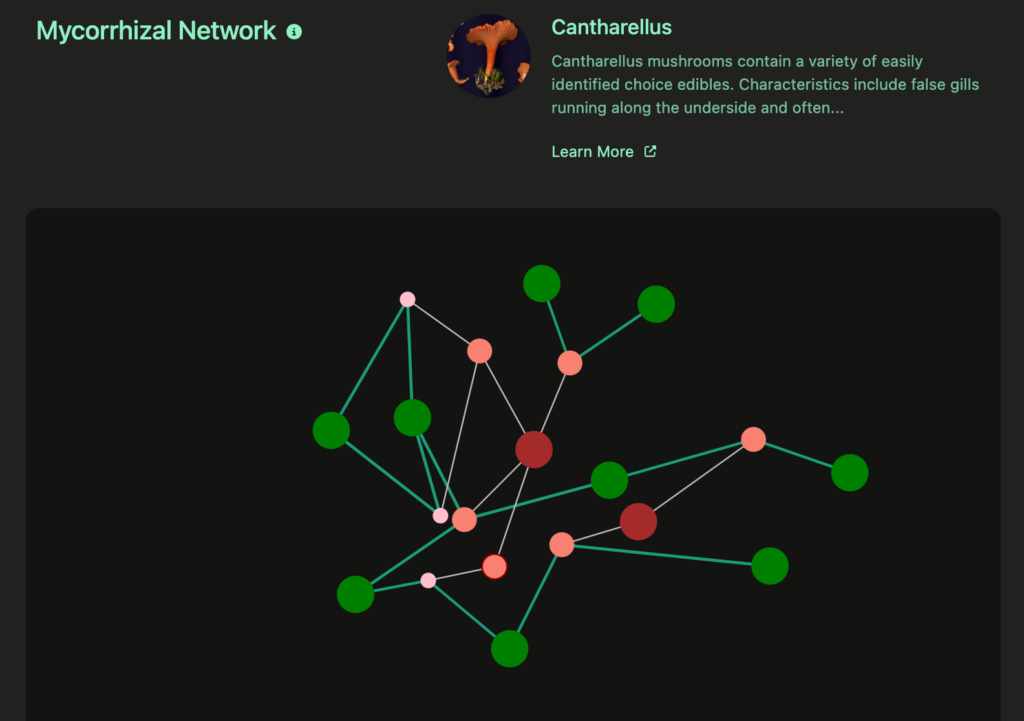
The visualization displays nodes the represent both trees and fungi, so it is important to distinguish these types of nodes. I went with green for tree nodes and used warmer (reddish-brownish) colors for fungi. I feel this color selection is intuitive and allows for interesting contrast.
Since the fungi are hierarchal, I decided to encode the different levels of fungi with both size and color, with groups having larger size and darker color while species have smaller sizes and lighter colors. This distinction will also make interaction more intuitive given the rollup functionality of the nodes and links.Use color and size to encode link types and strength
Since there are two different types of links in the visualization, its important for the user to be able to quickly determine the types of links when viewing. I selected a darker, color link for the more interesting direct relationships, while using a pale white color for the hierarchal links. I also used distinct, variable line thickness for the mycorrhizal links to encode strength of relationships while using thin, constant links to characterize the hierarchal links.Expanding/Contracting hierarchal nodes with link rollup
In order to simplify the initial chart and node layout, I wanted to have the hierarchal nodes rolled up to their highest level, and allow the user to toggle the nodes in order to expand and contract from groups, to genus, to species. This also means that the links connecting to n-depth nodes would need to be rolled up to their first visible ancestor.Allow the user the drag/reposition nodes
The user should be able to drag nodes to a fixed position without completely removing the influence of that node on the rest of the simulation. This should allow the user to organize the nodes in a way conducive to their interests without creating undesirable effects on the other nodes.Hover over links and nodes to get information
Hovering over nodes and links should highlight that element to the user, then render a tooltip to display some basic information on that element. The nodes should display name and type of node, while links should display name, type, strength, and benefits associated with the mycorrhizal relationship.The user should be able to select a node to display more information
I wanted to give the user the ability to select a node and have more information displayed on that node, such as an image, description, and link.
Implementation Challenges
Overlapping Nodes
While the collide force was adequate for keeping nodes from overlapping when their positions are influenced by the simulation, when their positions are fixed by the user drag event they are now technically outside of the simulation and thus node overlap is allowed.
This was solved by creating a custom findNode and pushNode functions that could be called during the drag even. This feature looks for a node within a specified radius of the node being dragged, then if one is detected push the closestNode proportionally.Variable forces between hierarchal and non-hierarchal nodes
Translating and encoding force strengths based on node hierarchy was a little challenging, and required defining custom callbacks for each of the forces. These, in turn, also required setting up linear scaling to account for variable strength based on node types as well as link types and strengths.Update the simulation based on node toggling and link rollup
For updating the simulation, A few steps had to be implemented. First a list of the currently visible nodes needs to be created, after which a set of ids should be created in order to ensure a faster lookup time. After that, hierarchal links should be removed from the visible link set without completely eliminating, while the direct links need to be rolled up to attach to the first visible parent node. All of this processing needs to happen without mutating the original node and link data.
The Final Product
out this interactive visualization!
Interactive network visualizations are among my favorite types of visualizations to build, and working on one around such an engaging topic has been especially rewarding. Beyond the fun of mapping natural systems, this kind of diagram has broad practical value: it can be used to clearly illustrate complex relationships between industries, organizations, departments, individuals, and their connections to specific events, tasks, or products. I’m looking forward to exploring one of those applications in a future project.